See demand over time
Chart new signups and open demand by day or week, and read the same figures as a table.
ProNeeds the Pro plan.
Before you start
- You’re on the Pro plan.
- Shoppers have been joining your waitlists.
- 1
Go to Over time on Analytics
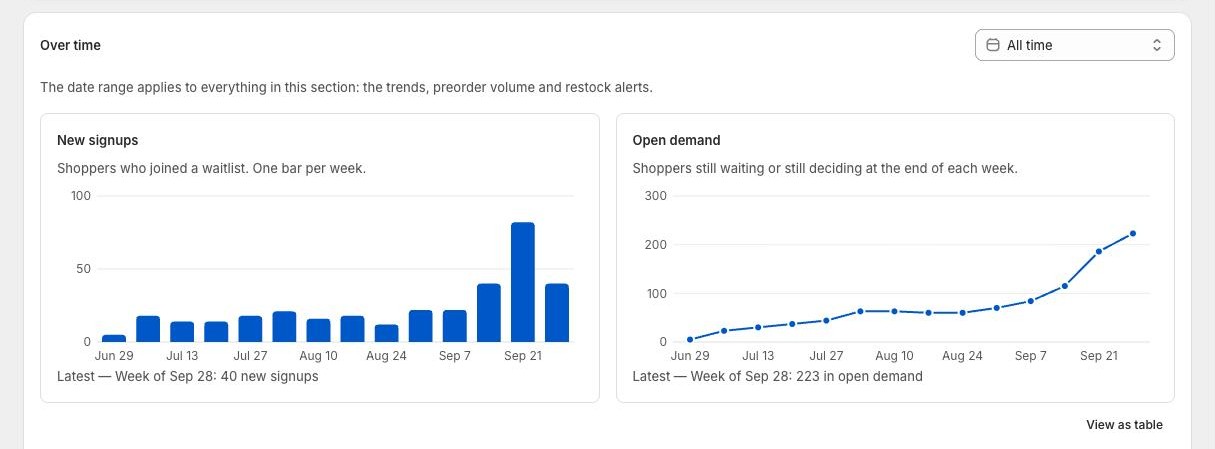
Select Analytics in the Waitly menu and scroll to Over time. Two charts sit side by side at the top of the section.
New signups is a bar for each day or week, counting shoppers who joined a waitlist. Open demand is a line showing how many shoppers were still waiting or still deciding at the end of each day or week.
Shopify admin · Waitly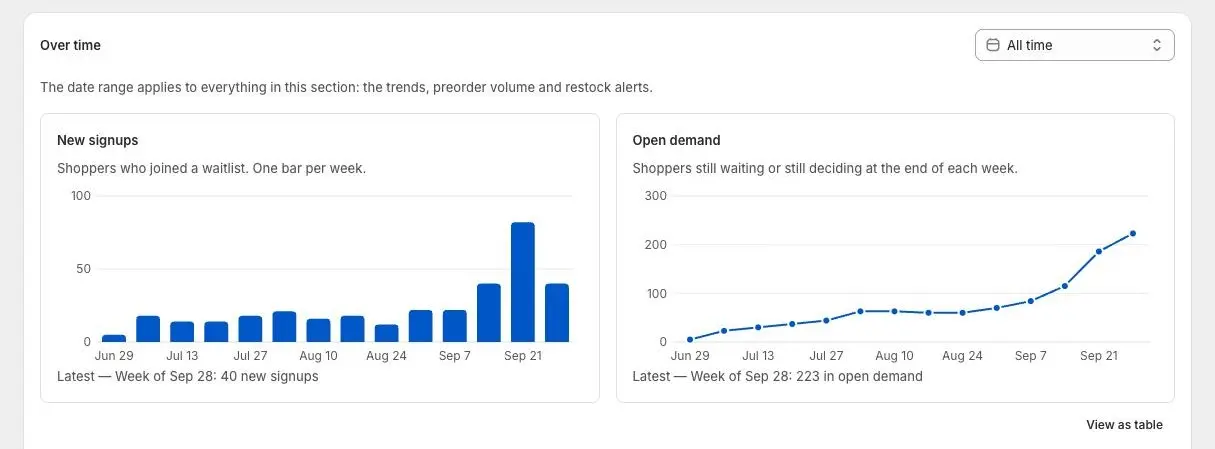
- 1Shoppers who joined
- 2Shoppers still waiting or deciding
Note: Below Pro, the chart frames and dates show with “Available on Pro” in place of the figures, and there’s no table.
- 2
Choose a date range
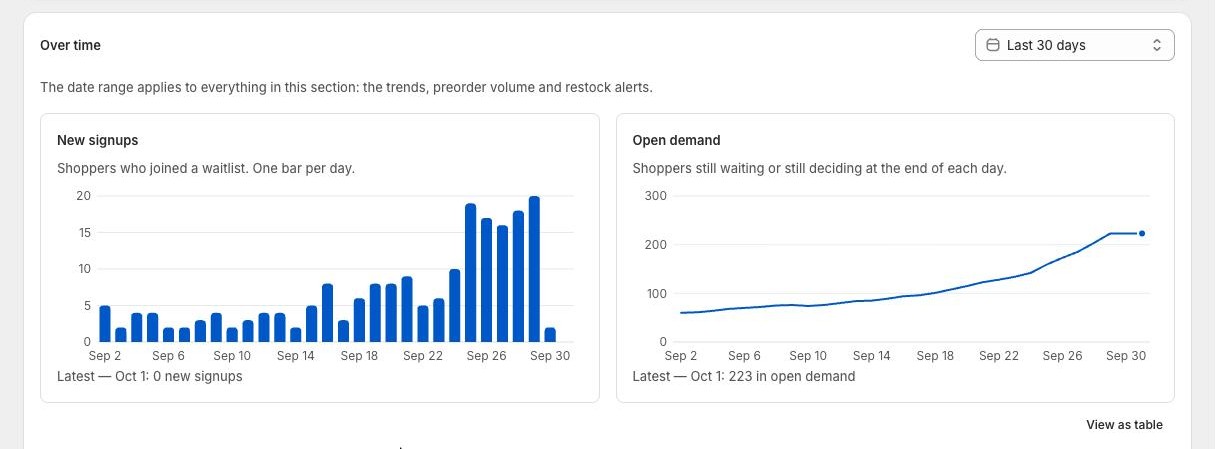
Use the date menu next to Over time. Last 7 days and Last 30 days show one bar per day, with today last and still counting. All time shows one bar per week, starting on Monday.
Last 24 hours is a single point, so no chart is drawn. Choose a longer range to see a trend.
Shopify admin · Waitly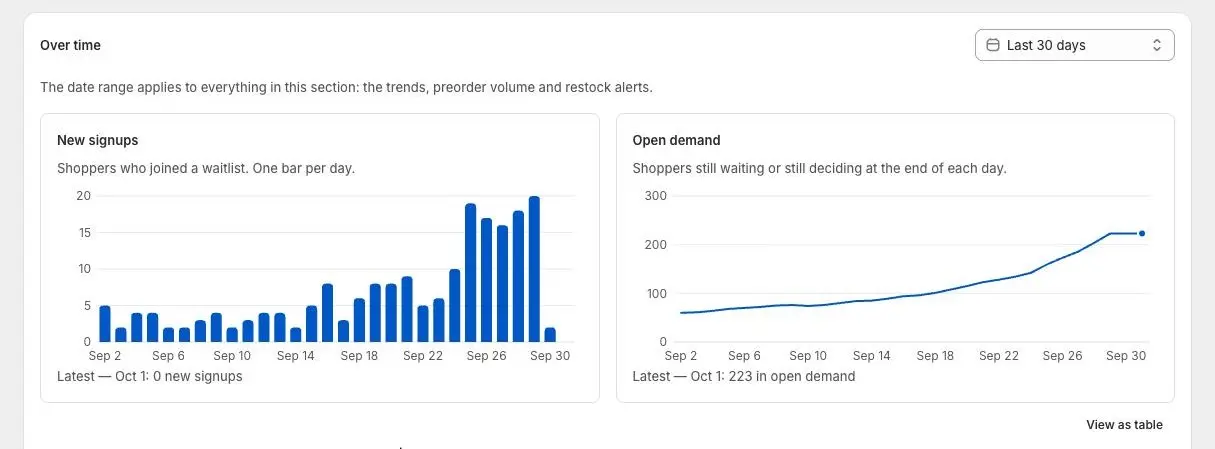
- 1Pick the date range
- 2One bar per day or week
- 3
Read a day or week
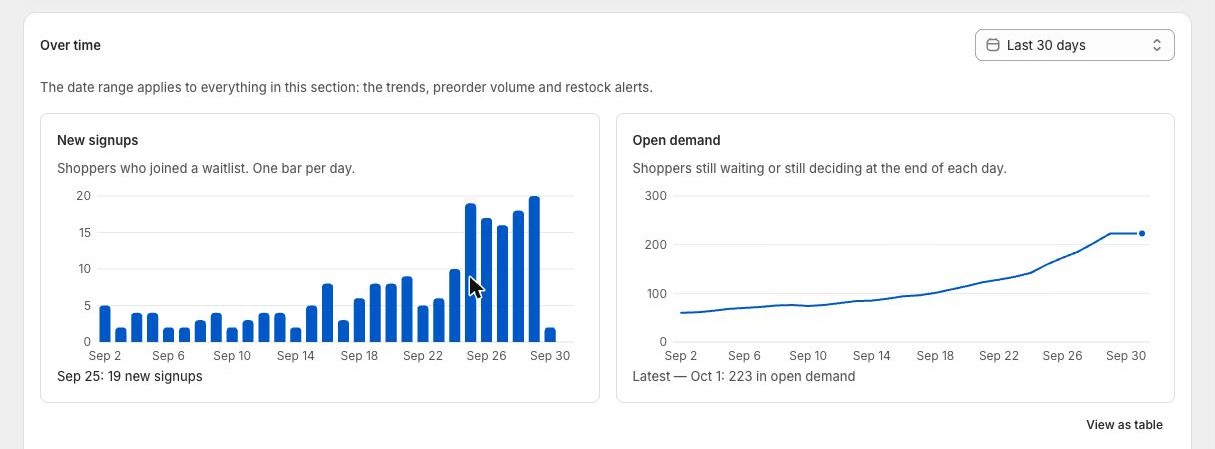
Under each chart, a line shows the latest figure. Point at a bar, or select the chart and use the arrow keys, to read any other day or week.
Days follow your store’s time zone. If Waitly can’t read it from Shopify, a note under the charts says the days are in UTC.
Shopify admin · Waitly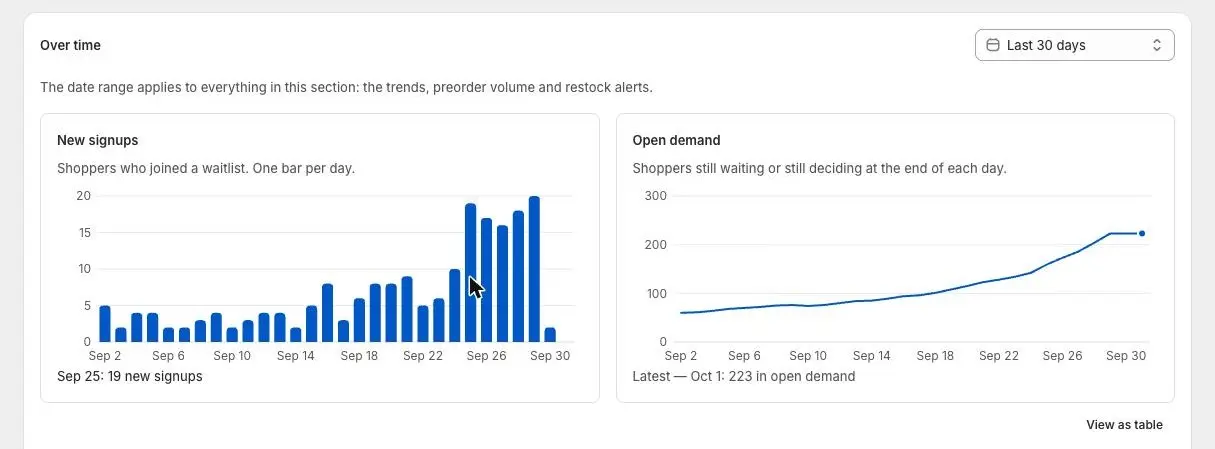
- 1Point at a bar
- 2Its day and count
- 4
View the figures as a table
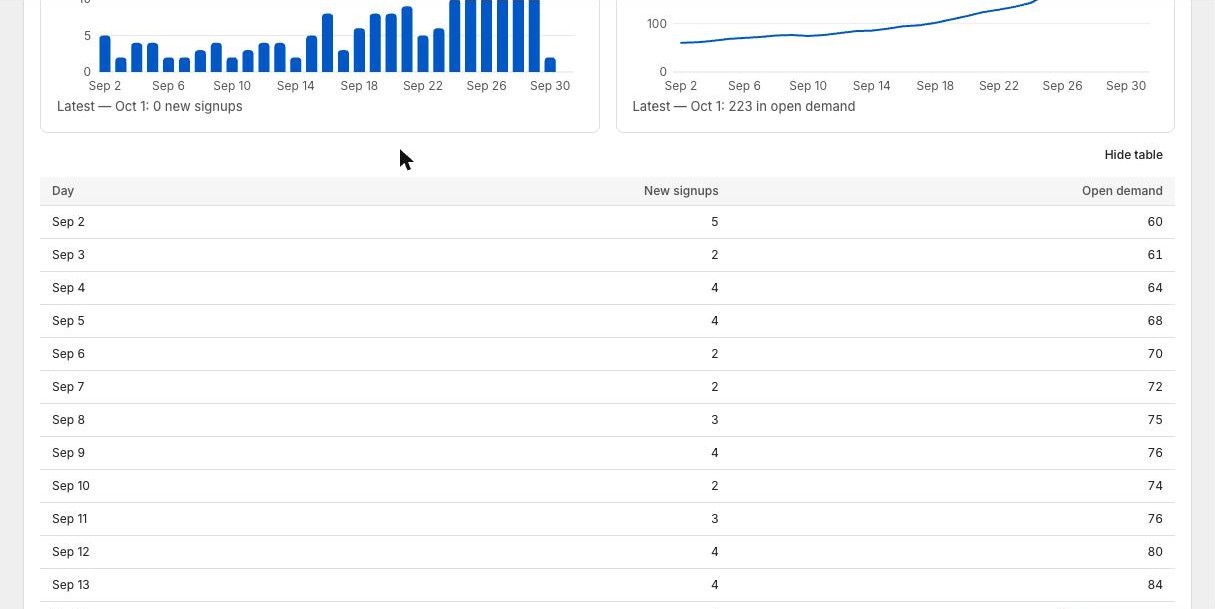
Select View as table under the charts. The table lists every Day (or Week) with its New signups and Open demand.
Select Hide table to close it.
Shopify admin · Waitly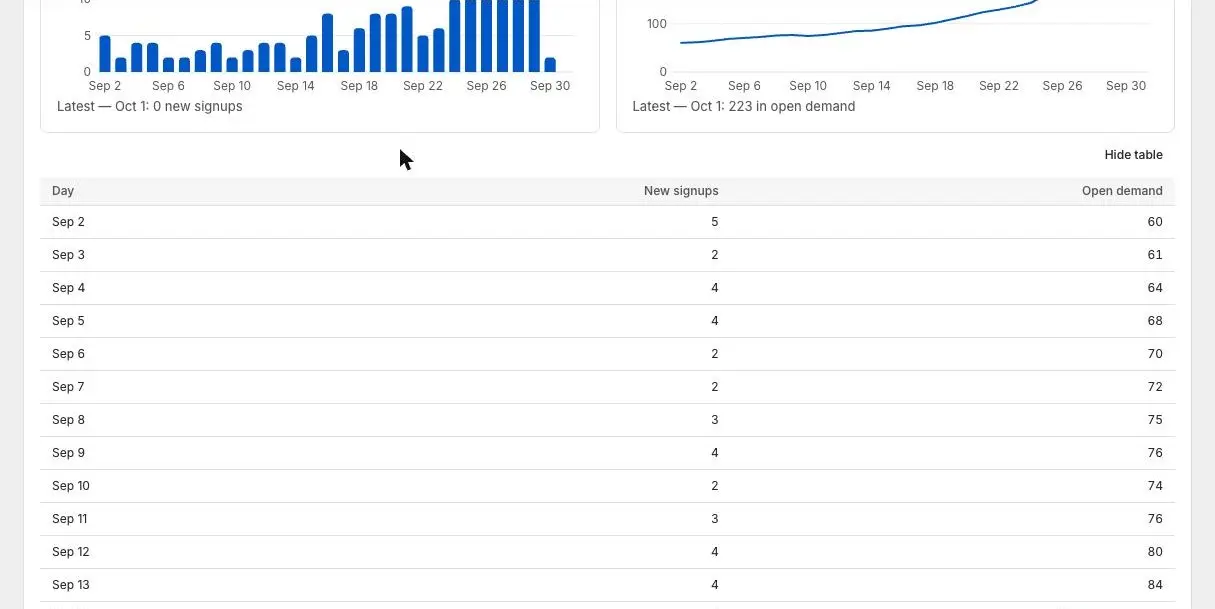
- 1Close the table
- 2One row per day or week
Questions
- Why does my All time chart start later than I installed Waitly?
- Waitly only keeps waitlist demand for the number of days set under Settings, Data retention. When that cuts the chart short, a note says so, for example “Waitly keeps 365 days of demand, so the chart starts there.”
- Does a shopper who bought count in Open demand?
- No. Open demand counts only shoppers still waiting, or alerted and still deciding, at the end of each day or week.
Read next
- Read your analyticsSee how many shoppers are waiting, what your alerts recovered, and how the rest of the demand ended.
- Plan restocks with Demand ScoreSee which products shoppers want most, what Waitly suggests you do, and roughly how many units to restock.
- Choose how long to keep demandSet how long Waitly keeps waitlist signups that have gone quiet or ended, from 30 to 365 days.